

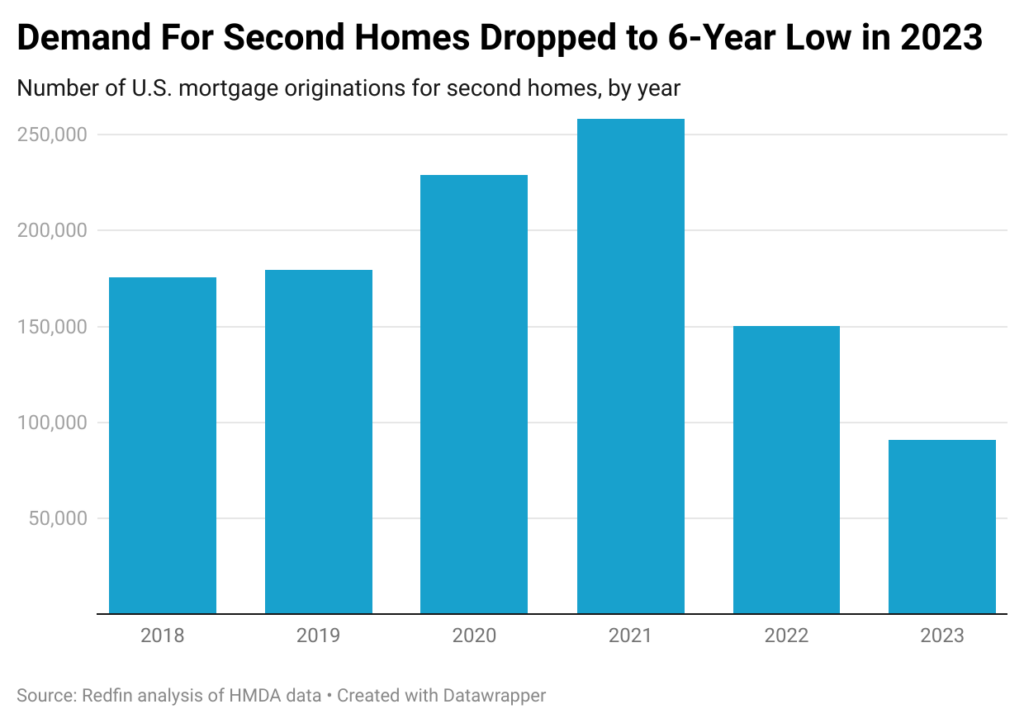
The vacation home mortgage market has witnessed a notable decline in 2023. With changing economic conditions and shifts in buyer preferences, the dynamics of purchasing second homes have transformed. This article dives into why the market for vacation home mortgages is slowing down, and what potential buyers should consider.

Understanding the Decline in Vacation Home Mortgage Demand
Economic factors play a significant role in the recent downturn in vacation home mortgages. Rising interest rates and economic uncertainty have made buyers more cautious. For example, as lending rates climb, the cost of borrowing increases, making it less attractive to finance a second home. This trend is coupled with a general tightening of credit conditions, which adds another layer of complexity for potential buyers.
Impact on Potential Buyers
If you’re considering buying a vacation home, it’s essential to understand how these market conditions affect your purchasing power. Buyers now face higher monthly repayments and more stringent lending criteria, which may necessitate a larger down payment or settling for a less expensive property. It’s advisable to assess your financial stability and consult with mortgage professionals to get a clear picture of what you can afford in the current market.

Market Outlook
Despite the current slowdown, the long-term outlook for vacation homes could see a rebound. Market analysts suggest that as economic conditions stabilize, interest in vacation homes may gradually return. Prospective buyers should stay informed about market trends and be ready to act when conditions are favorable, potentially securing a valuable investment.
| Metro-level summary: Mortgages for second homes, 2023
50 most populous U.S. metros |
||||
| U.S. metro area | Second-home mortgage originations | Second-home mortgage originations, YoY change | Share of total mortgage originations that were for second homes | Median value of second homes |
| Anaheim, CA | 444 | -36.7% | 2.9% | $1,335,000 |
| Atlanta, GA | 734 | -45.2% | 1.0% | $435,000 |
| Austin, TX | 388 | -62.5% | 1.1% | $495,000 |
| Baltimore, MD | 222 | -45.6% | 0.8% | $515,000 |
| Boston, MA | 428 | -43.9% | 1.2% | $805,000 |
| Charlotte, NC | 454 | -42.5% | 1.2% | $445,000 |
| Chicago, IL | 448 | -48.4% | 0.7% | $365,000 |
| Cincinnati, OH | 181 | -41.8% | 0.7% | $325,000 |
| Cleveland, OH | 119 | -39.3% | 0.6% | $225,000 |
| Columbus, OH | 212 | -41.3% | 0.9% | $420,000 |
| Dallas, TX | 447 | -45.9% | 0.6% | $485,000 |
| Denver, CO | 514 | -36.2% | 1.3% | $675,000 |
| Detroit, MI | 73 | -32.4% | 0.5% | $245,000 |
| Fort Lauderdale, FL | 679 | -47.0% | 3.5% | $445,000 |
| Fort Worth, TX | 215 | -45.6% | 0.7% | $435,000 |
| Houston, TX | 1114 | -47.5% | 1.4% | $405,000 |
| Indianapolis, IN | 254 | -32.4% | 0.9% | $325,000 |
| Jacksonville, FL | 680 | -43.7% | 2.7% | $475,000 |
| Kansas City, MO | 206 | -31.1% | 0.8% | $335,000 |
| Las Vegas, NV | 877 | -49.6% | 3.1% | $455,000 |
| Los Angeles, CA | 512 | -51.1% | 1.3% | $1,305,000 |
| Miami, FL | 602 | -46.2% | 3.1% | $715,000 |
| Milwaukee, WI | 145 | -45.7% | 1.0% | $355,000 |
| Minneapolis, MN | 393 | -38.1% | 0.9% | $420,000 |
| Montgomery County, PA | 91 | -32.1% | 0.5% | $510,000 |
| Nashville, TN | 394 | -51.3% | 1.4% | $510,000 |
| Nassau County, NY | 600 | -43.6% | 2.8% | $1,725,000 |
| New Brunswick, NJ | 858 | -45.4% | 3.9% | $885,000 |
| New York, NY | 865 | -53.9% | 1.8% | $985,000 |
| Newark, NJ | 280 | -37.5% | 1.6% | $375,000 |
| Oakland, CA | 99 | -50.5% | 0.5% | $995,000 |
| Orlando, FL | 1483 | -36.9% | 4.1% | $445,000 |
| Philadelphia, PA | 124 | -50.2% | 0.7% | $355,000 |
| Phoenix, AZ | 2001 | -46.5% | 3.2% | $535,000 |
| Pittsburgh, PA | 181 | -38.2% | 0.9% | $285,000 |
| Portland, OR | 258 | -50.0% | 1.1% | $605,000 |
| Providence, RI | 363 | -31.1% | 2.7% | $775,000 |
| Riverside, CA | 1566 | -47.1% | 4.0% | $655,000 |
| Sacramento, CA | 455 | -48.8% | 2.1% | $805,000 |
| San Antonio, TX | 438 | -51.1% | 1.3% | $335,000 |
| San Diego, CA | 411 | -45.4% | 2.1% | $1,115,000 |
| San Francisco, CA | 112 | -57.6% | 1.6% | $1,355,000 |
| San Jose, CA | 69 | -35.5% | 0.7% | $1,300,000 |
| Seattle, WA | 239 | -53.0% | 0.8% | $795,000 |
| St. Louis, MO | 303 | -25.2% | 0.9% | $315,000 |
| Tampa, FL | 1618 | -41.5% | 3.6% | $425,000 |
| Virginia Beach, VA | 415 | -47.5% | 1.8% | $525,000 |
| Warren, MI | 281 | -32.1% | 1.0% | $325,000 |
| Washington, DC | 436 | -46.1% | 0.9% | $655,000 |
| West Palm Beach, FL | 1081 | -37.0% | 6.6% | $635,000 |


The decline in the vacation home mortgage market reflects broader economic shifts and changes in consumer behavior. By staying informed and cautiously planning, potential buyers can navigate these turbulent times effectively.
Related posts:
 Affordable Rental Provider Repays $710K to Arlington County
 Decline in Home Prices: Anticipating a Shift in 2024
 Maryland Governor Legislative Agenda: Military Families, Housing, and Public Safety in 2024
 Nashville’s Zoning Bills for Middle-Income Housing Spark Contentious Debate
 Tampa Affordable Housing Initiative Breaks Ground on New 188-Unit Building

