The housing market has recently reached the highest housing inventory levels since 2019, marking a significant shift in the real estate landscape. After years of restricted inventory, October saw a surge in active home listings, with Realtor.com reporting a 29.2% increase compared to last year. This upward trend in listings reflects a nationwide pattern, particularly in former pandemic boomtowns like Austin, Memphis, and Orlando, where more sellers are placing homes on the market. This increased supply provides much-needed relief for potential buyers who have faced intense competition over the past few years.
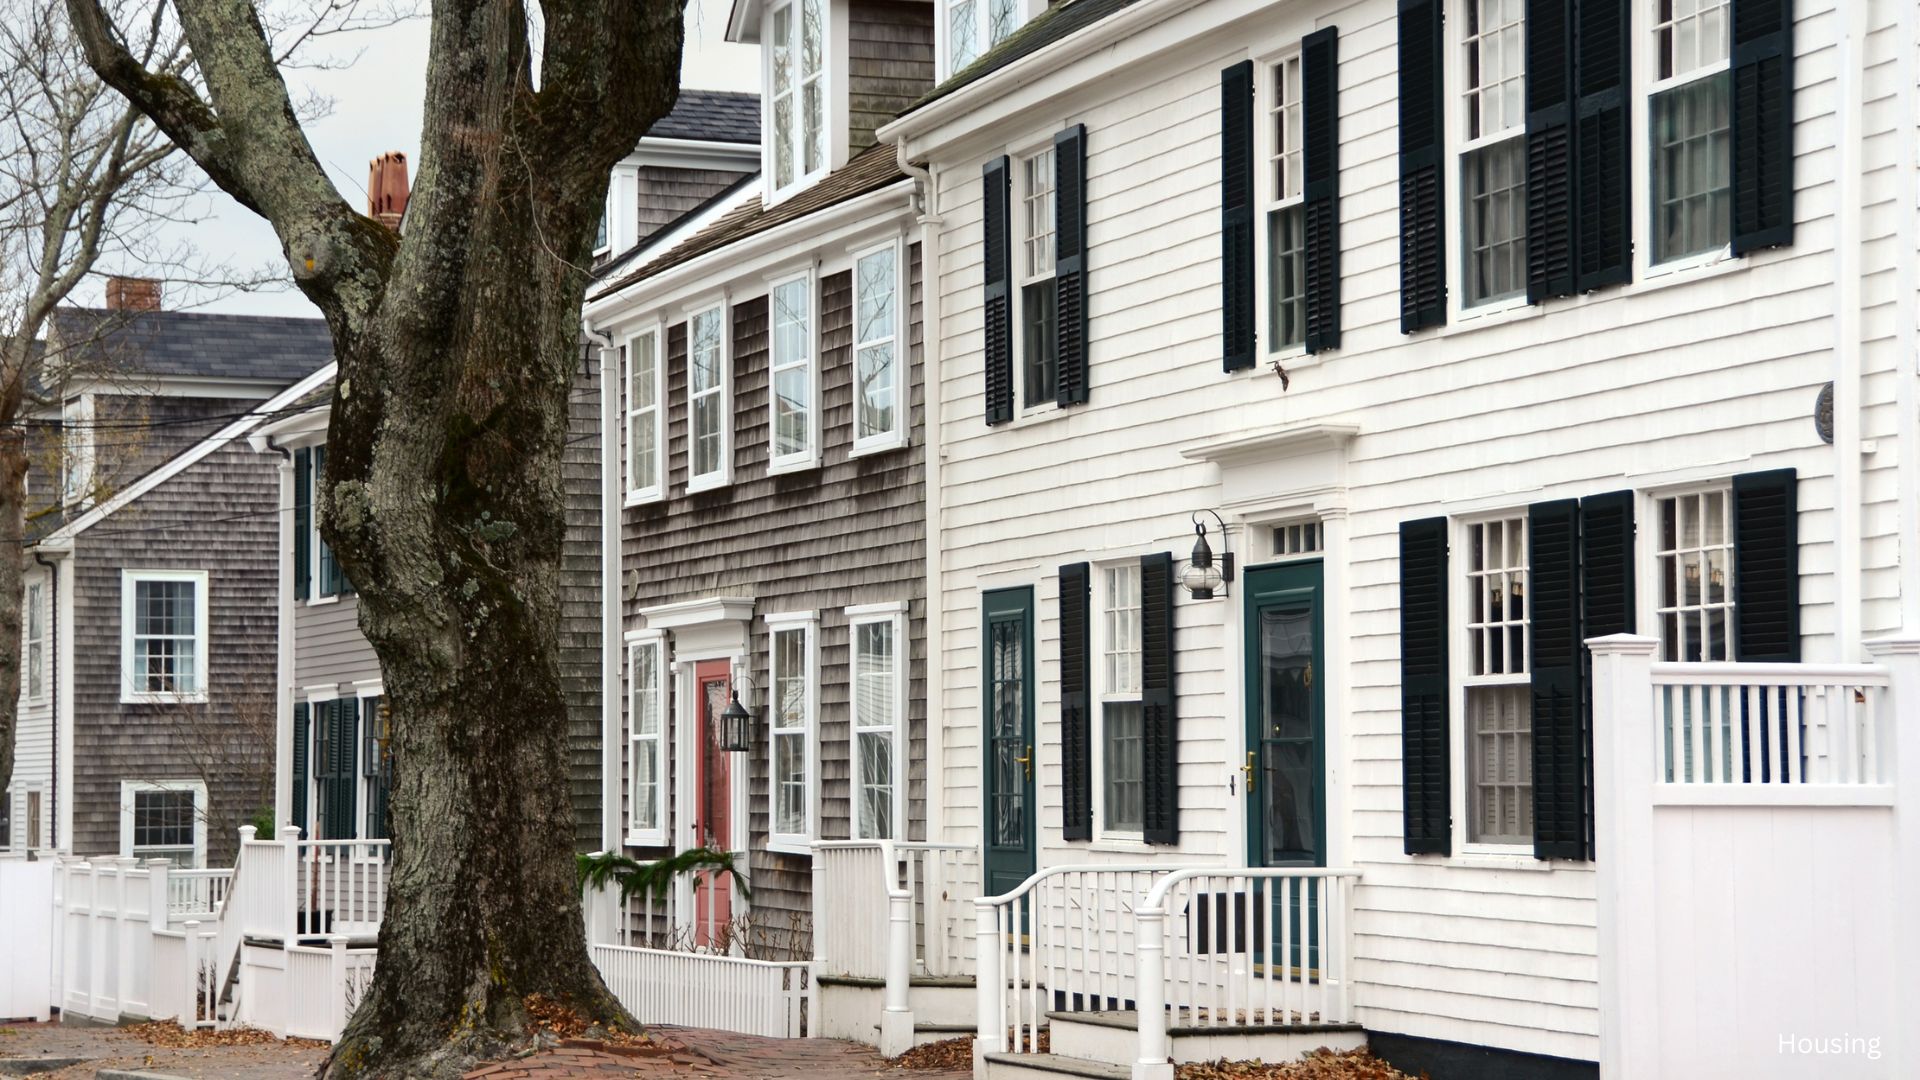
The Rise in Housing Inventory and Its Regional Impact
The housing inventory surge isn’t limited to any one region but spans across the country. The South leads in growth, followed closely by the West, where active listings have risen 33.6%. This trend is also seen in the Midwest and Northeast, indicating a nationwide shift as homeowners respond to falling mortgage rates by listing properties. Realtor.com’s senior economist Ralph McLaughlin points out that a dip in mortgage rates back in August could have nudged many sellers off the fence, contributing to the overall spike in inventory. The increase in available homes is expected to continue as we move through November and December.

Market Changes in Pandemic Boomtowns
The highest housing inventory rise has been most notable in popular “pandemic boomtowns.” Cities like Austin, Memphis, and Orlando experienced housing market surges during the pandemic, attracting many buyers with remote work opportunities and affordable living costs. Now, these same cities are witnessing the highest inventory levels, with Austin’s listings increasing by 40.1%, Memphis by 39.2%, and Orlando by 26.6% year-over-year. This change reflects a balancing of the market, as more properties become available, giving buyers more options and reducing the urgency to make quick purchasing decisions.
Housing Inventory and Home Prices: Stability Amidst Change
Despite this surge in inventory, home prices have remained stable, with the national median price holding at $424,950. The highest housing inventory since 2019 might lead buyers to expect falling prices; however, the Realtor.com report notes that the price per square foot has actually increased by 2.1% year-over-year. This trend can be attributed to a shift toward higher-priced, smaller homes. So, while the sticker prices remain steady, the actual cost per square foot reflects increased demand for certain property types.
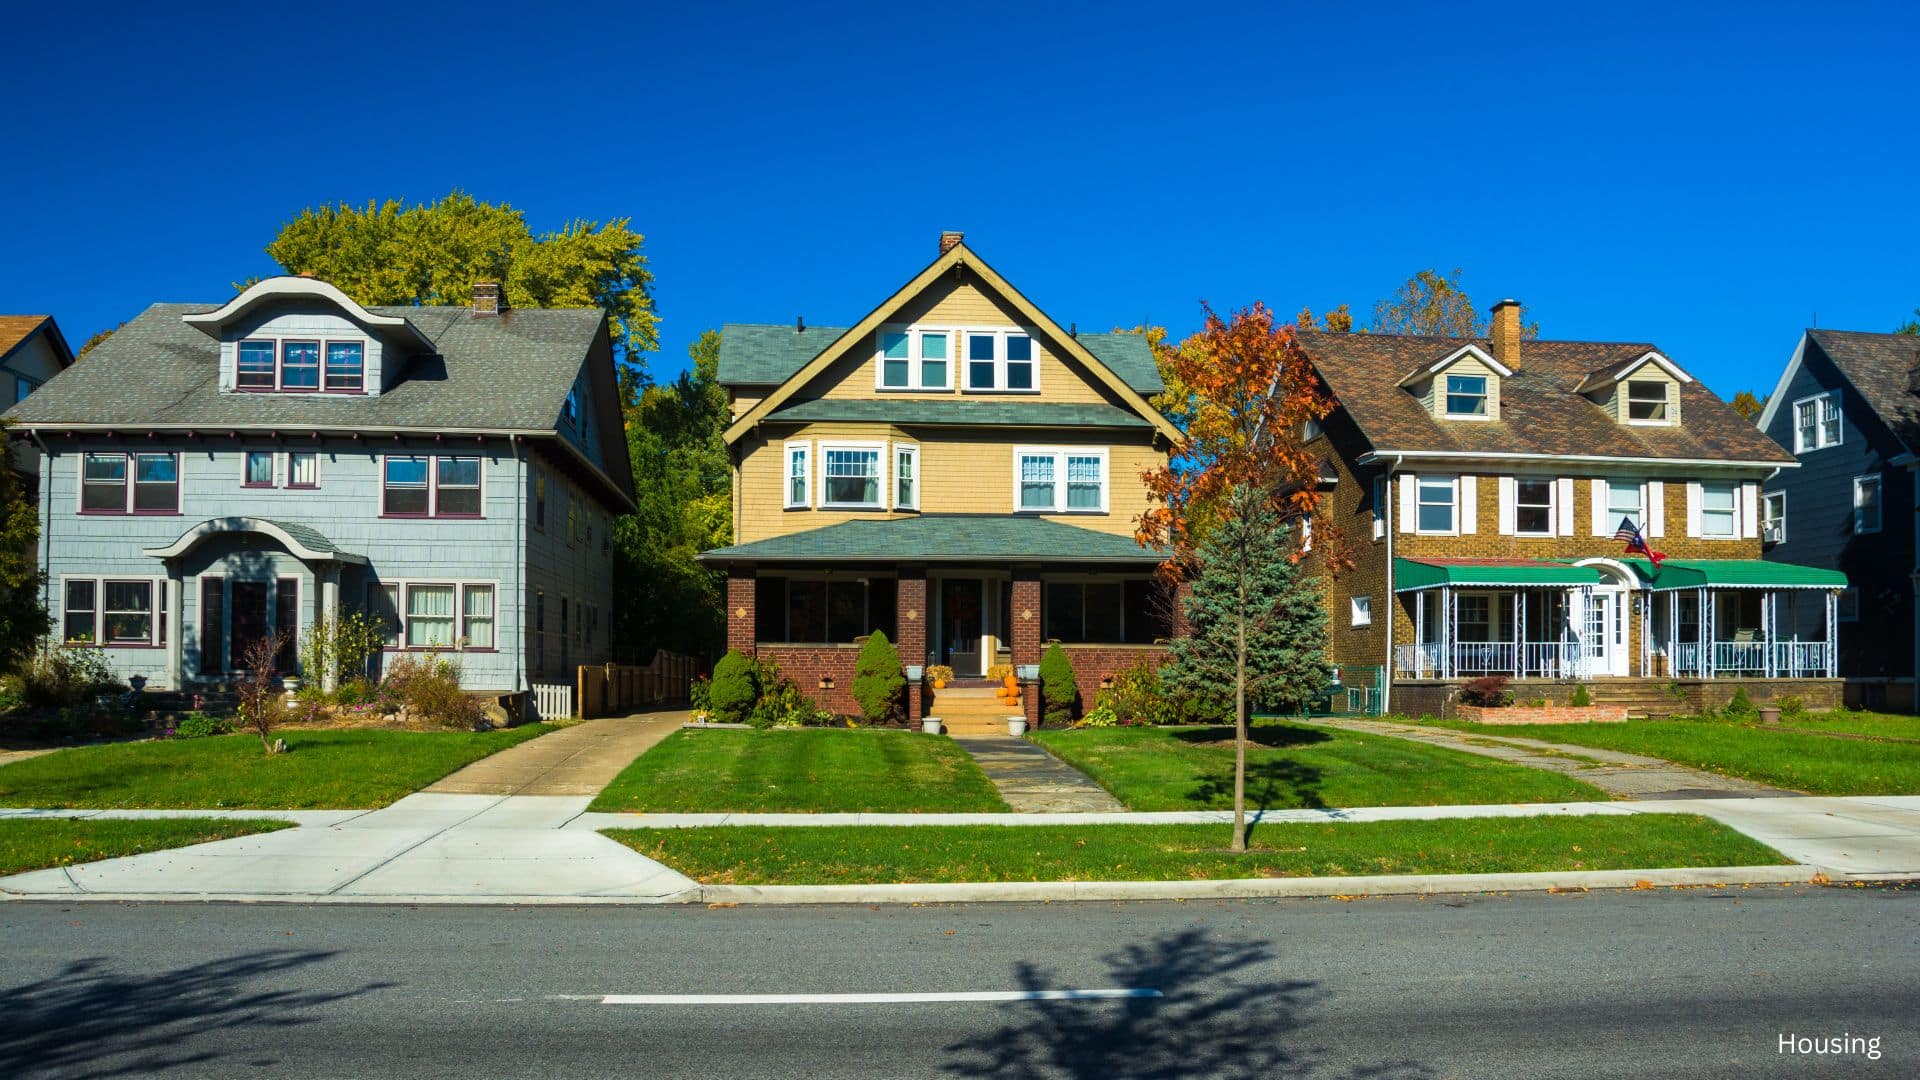
Impact on Buyers and Sellers Moving Forward
For buyers, this highest housing inventory offers more choices and a less competitive market environment. Homes are staying on the market for an average of 58 days, which is a week longer than last year and marks the slowest pace since 2019. This additional time allows buyers to make more considered decisions rather than feeling pressured to act quickly. However, Realtor.com warns that the increased listings may attract more buyers, potentially ramping up competition again as mortgage rates continue to ease.
For sellers, the increased inventory may prompt careful pricing strategies to attract buyers in a now more saturated market. As the trend continues, both buyers and sellers will need to monitor mortgage rate fluctuations, which may further impact the housing inventory levels into the new year.
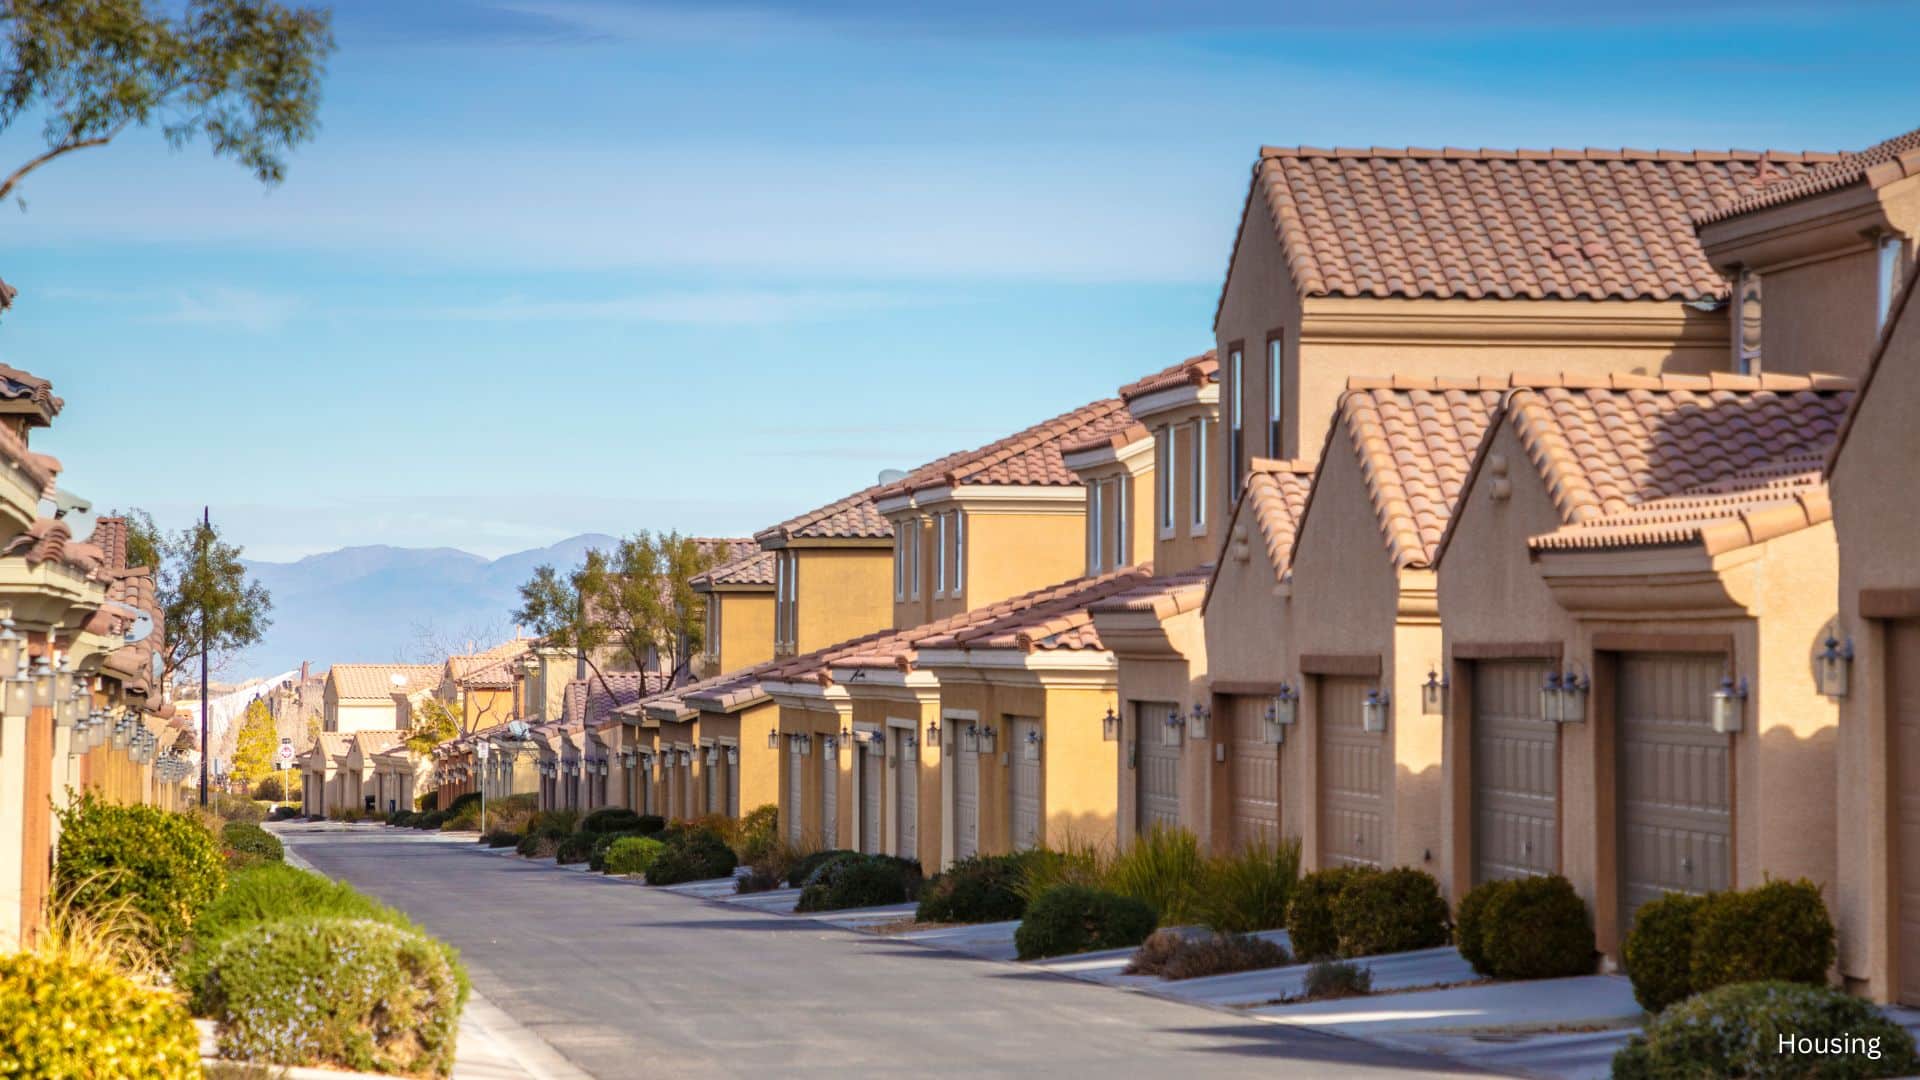
A Market Rebalancing with the Highest Housing Inventory Since 2019
The highest housing inventory levels since 2019 mark a rebalancing in the housing market, providing more opportunities for buyers and encouraging strategic thinking for sellers. As inventory levels continue to rise, supported by favorable mortgage rates and a broader economic shift, the real estate market may gradually transition into a buyer-friendly environment. Realtor.com’s analysis suggests that this trend is expected to extend through the end of the year, potentially easing some of the intense competition seen in recent years and bringing stability back to the market.
Related posts:
 Affordable Rental Provider Repays $710K to Arlington County
 Northern Virginia Housing Market – March 2023
 Supply Skepticism: The Complex Puzzle in US Housing 2023
 Mortgage Rates Drop Below 7%: A Ray of Hope for the Housing Market?
 Buffalo Housing Market: A 2024 Success Story of Growth and Affordability
