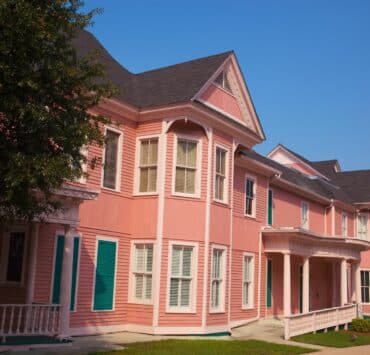
As the housing market experiences a collective exhale, with whispers of a cooldown circulating, there remain pockets of intense activity. Florida Atlantic University, armed with data and statistical acumen, delves into the realms of real estate, unveiling the 10 most overpriced housing markets in America. Let’s embark on a journey through these markets, dissecting the numbers, understanding the disparities, and contemplating the implications for both buyers and sellers.
Assessing Overpricing: The Methodology
To discern the overpriced markets, Florida Atlantic University adopted a meticulous approach. By comparing the average expected home values based on historical trends against the average list prices across the 100 largest metro areas, the study identified cities with the most substantial percentage differences between the two metrics.
The Top 10 Overpriced Housing Markets
Nashville, Tennessee
|
Average Listing Price |
Expected Home Value |
Difference |
| Stats |
$420,932 |
$296,827 |
41.81% |
| Insight |
The enchanting city of Nashville kicks off our list, witnessing a 41.81% difference between expected home values and list prices. |
|
|
Tampa, Florida
|
Average Listing Price |
Expected Home Value |
Difference |
| Stats |
$361,065 |
$252,643 |
42.9% |
| Insight |
Tampa, basking in the Florida sun, follows closely with a 42.9% differential, capturing the attention of prospective buyers. |
|
|
Deltona, Florida
|
Average Listing Price |
Expected Home Value |
Difference |
| Stats |
$334,978 |
$233,050 |
43.74% |
| Insight |
The scenic landscapes of Deltona conceal a 43.74% difference, posing questions about the dynamics at play in this Florida market. |
|
|
Detroit, Michigan
|
Average Listing Price |
Expected Home Value |
Difference |
| Stats |
$226,101 |
$157,046 |
43.97% |
| Insight |
Detroit, with a historical narrative, surprises with a 43.97% gap, sparking conversations about the city’s real estate trajectory. |
|
|
Palm Bay, Florida
|
Average Listing Price |
Expected Home Value |
Difference |
| Stats |
$345,520 |
$238,308 |
44.99% |
| Insight |
Palm Bay enters the spotlight with a 44.99% difference, inviting scrutiny into the factors contributing to this significant margin. |
|
|
Lakeland, Florida
|
Average Listing Price |
Expected Home Value |
Difference |
| Stats |
$303,766 |
$209,260 |
45.16% |
| Insight |
Lakeland, nestled in the Floridian landscape, showcases a 45.16% divergence, prompting exploration into the nuances of this market. |
|
|
Memphis, Tennessee
|
Average Listing Price |
Expected Home Value |
Difference |
| Stats |
$225,958 |
$154,575 |
46.18% |
| Insight |
Memphis emerges with a 46.18% difference, encouraging a closer look at the economic dynamics influencing this Tennessee city. |
|
|
Charlotte, North Carolina
|
Average Listing Price |
Expected Home Value |
Difference |
| Stats |
$355,613 |
$240,670 |
47.76% |
| Insight |
The Queen City, Charlotte, unveils a 47.76% disparity, raising questions about the forces shaping the real estate narrative in this North Carolina hub. |
|
|
Cape Coral, Florida
|
Average Listing Price |
Expected Home Value |
Difference |
| Stats |
$375,812 |
$251,100 |
49.67% |
| Insight |
Cape Coral positions itself as a focal point with a 49.67% difference, prompting considerations about the sustainability of this margin in the long run. |
|
|
Atlanta, Georgia
|
Average Listing Price |
Expected Home Value |
Difference |
| Stats |
$357,677 |
$236,627 |
51.16% |
| Insight |
Atlanta takes the lead with a staggering 51.16% difference, steering conversations towards the factors contributing to this pronounced overpricing. |
|
|
Unraveling the Narrative: What Lies Ahead?
As we dissect the numbers and traverse the varied landscapes of these overpriced markets, the future remains uncertain. The narratives of Nashville, Tampa, Detroit, and others unfold against a backdrop of economic shifts, buyer behaviors, and regional dynamics. What lies ahead for these markets, and how will the tale of overpricing evolve? Only time will reveal the next chapter in this intricate saga of American real estate.
 Reduce Your Environmental Footprint: Simple Water Conservation Tips for Your Home
 10 Precautions to Stay Safe During a Home Renovation
 Increase in US Home Construction in 2023 Signals Robust Market Recovery
 2024 Military Housing Panel: Empowering Voices of Military Families
 Healthcare or Housing? An Increasing Number of States Redirect Medicaid Funds to Aid the Homeless


