
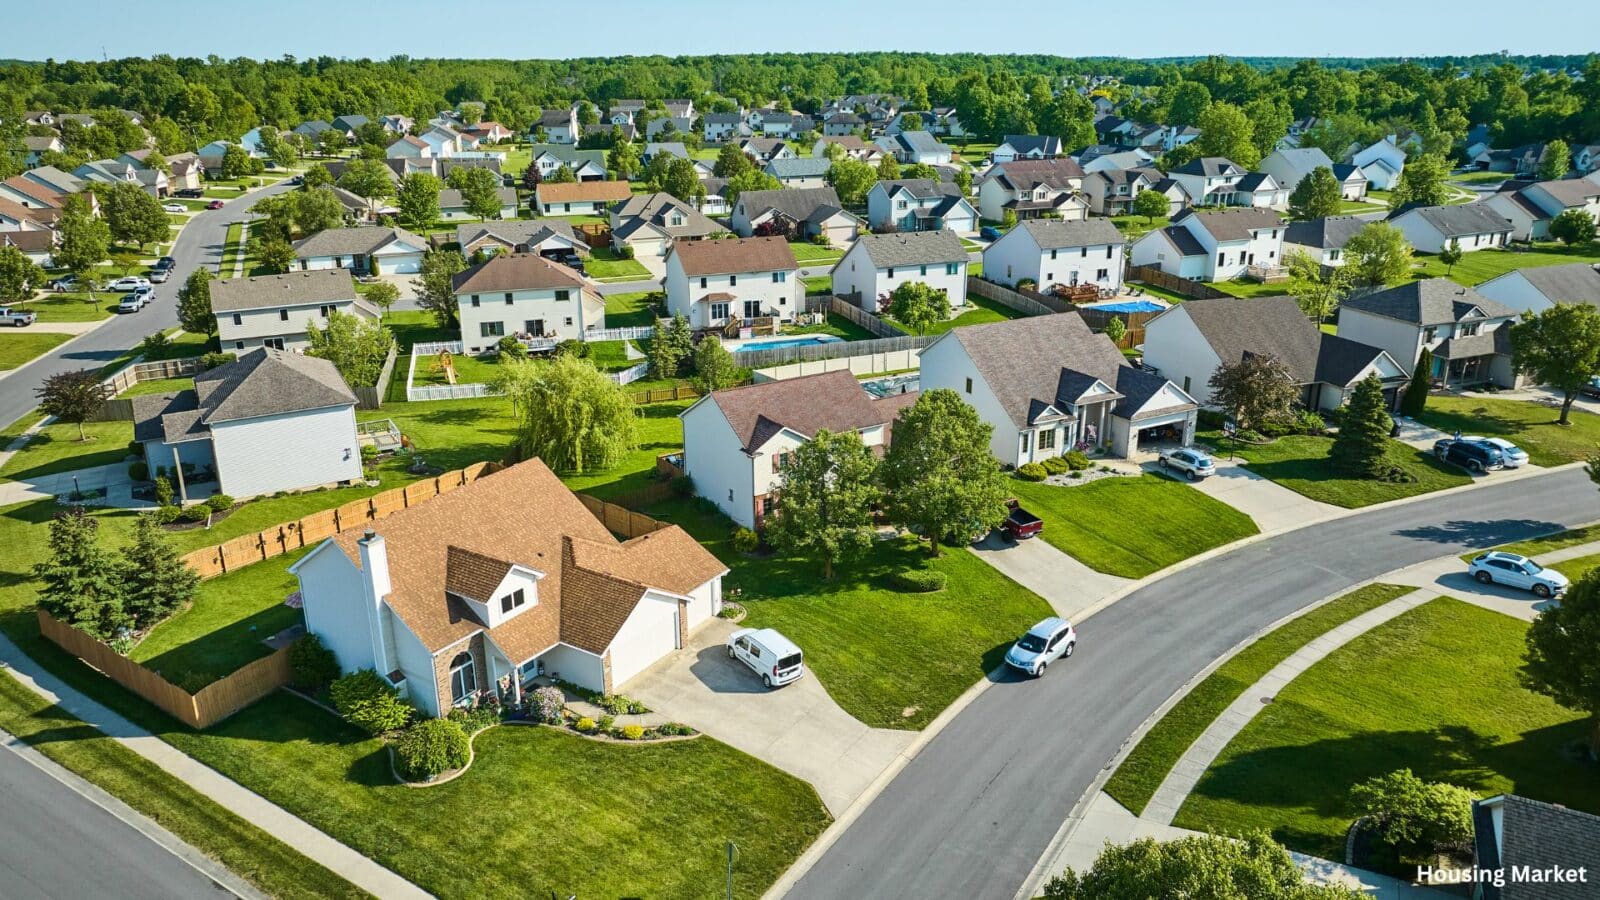
The U.S. housing market has experienced a significant shift in recent years, with a notable spike in average US square foot costs since 2019. This dramatic increase has affected homebuyers, sellers, and the overall real estate landscape.
Spike in Average US Square Foot Costs
Since 2019, the price per square foot of an average home in the US has soared, reflecting broader economic trends and changes in the housing market. Factors such as increased demand, limited housing supply, and inflation have contributed to this upward trend. According to Realtor.com, the national median price per square foot surged from $153 in 2019 to over $230 in 2023, marking a nearly 50% increase.
Factors Driving the Spike
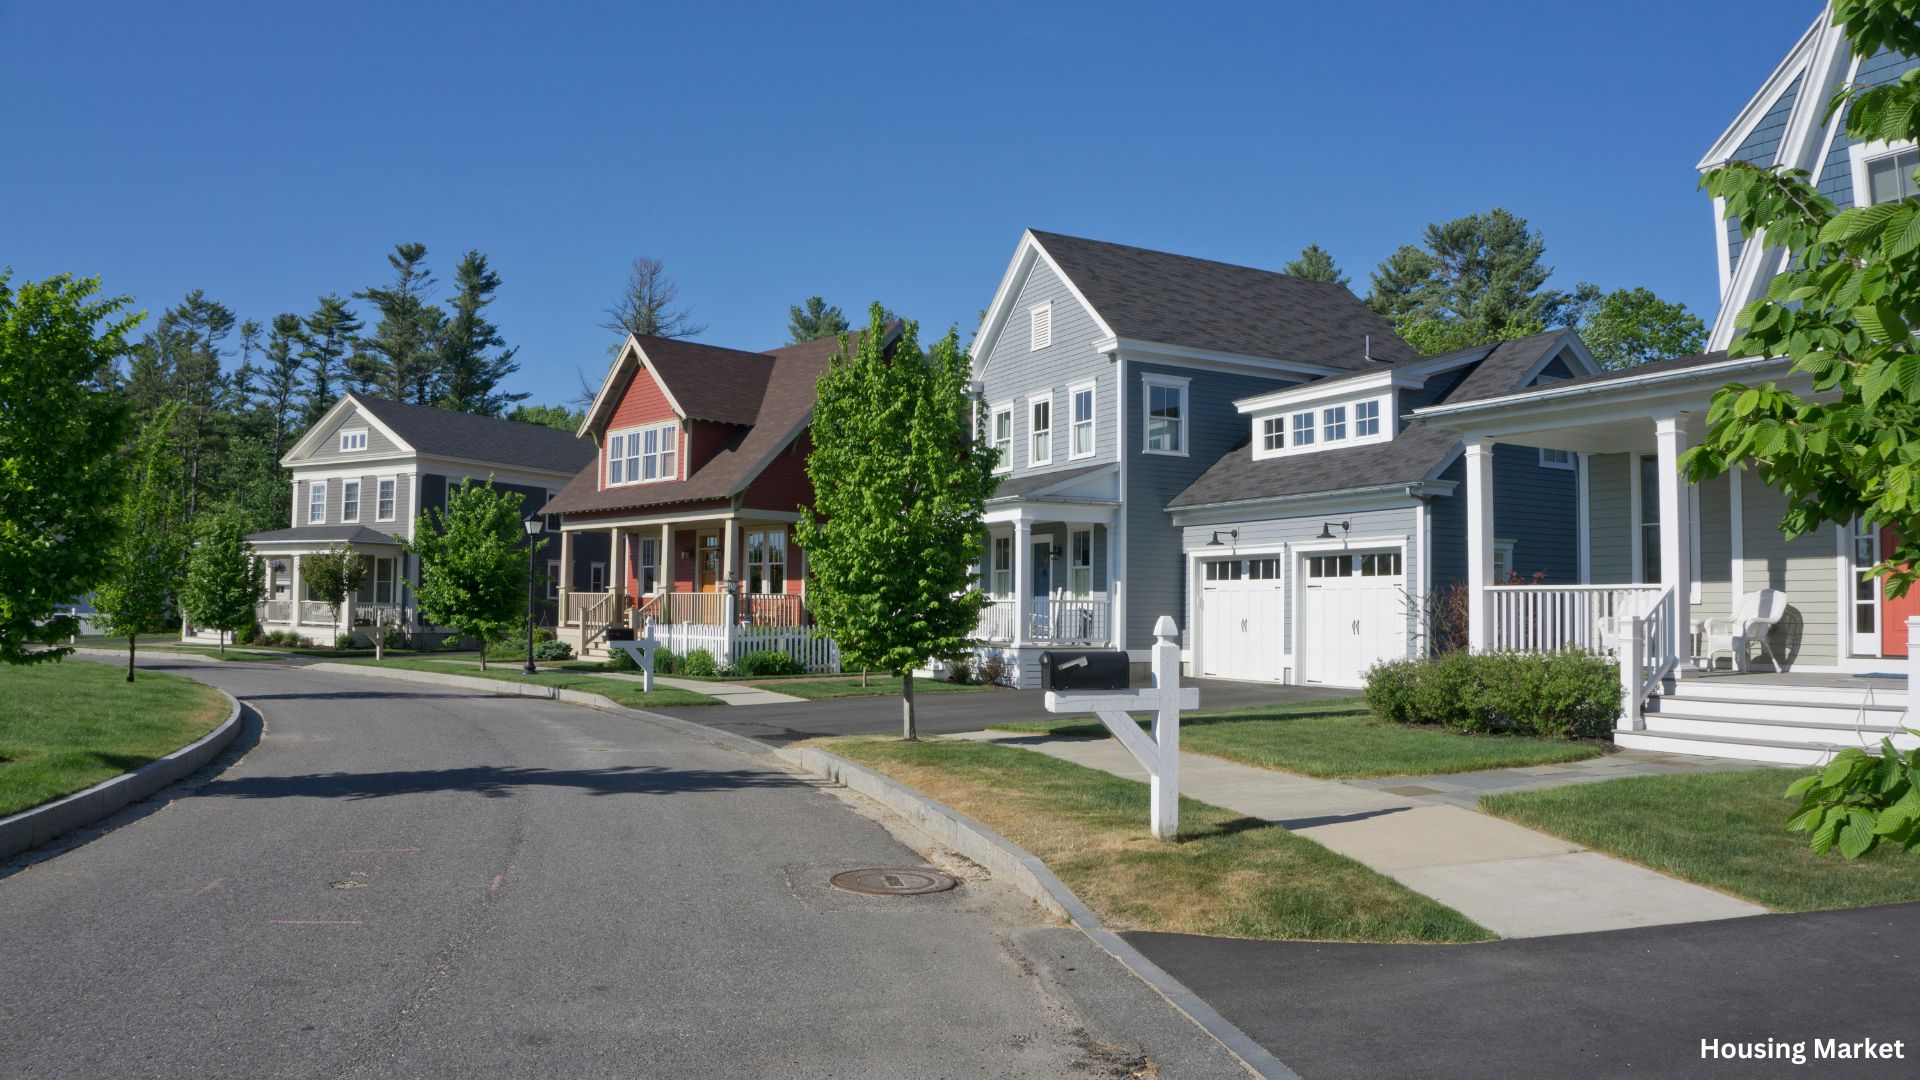
Several key factors have driven the spike in average US square foot costs. First, the COVID-19 pandemic altered buying patterns, with many people seeking larger homes and more space due to remote work and lifestyle changes. This shift in demand, combined with historically low mortgage rates, fueled a competitive market where prices skyrocketed.
Second, supply chain disruptions and increased construction costs have also played a role. The cost of building materials, labor shortages, and delays have driven up the costs for new construction, which in turn affects the pricing of existing homes.
Regional Variations in Price Increases
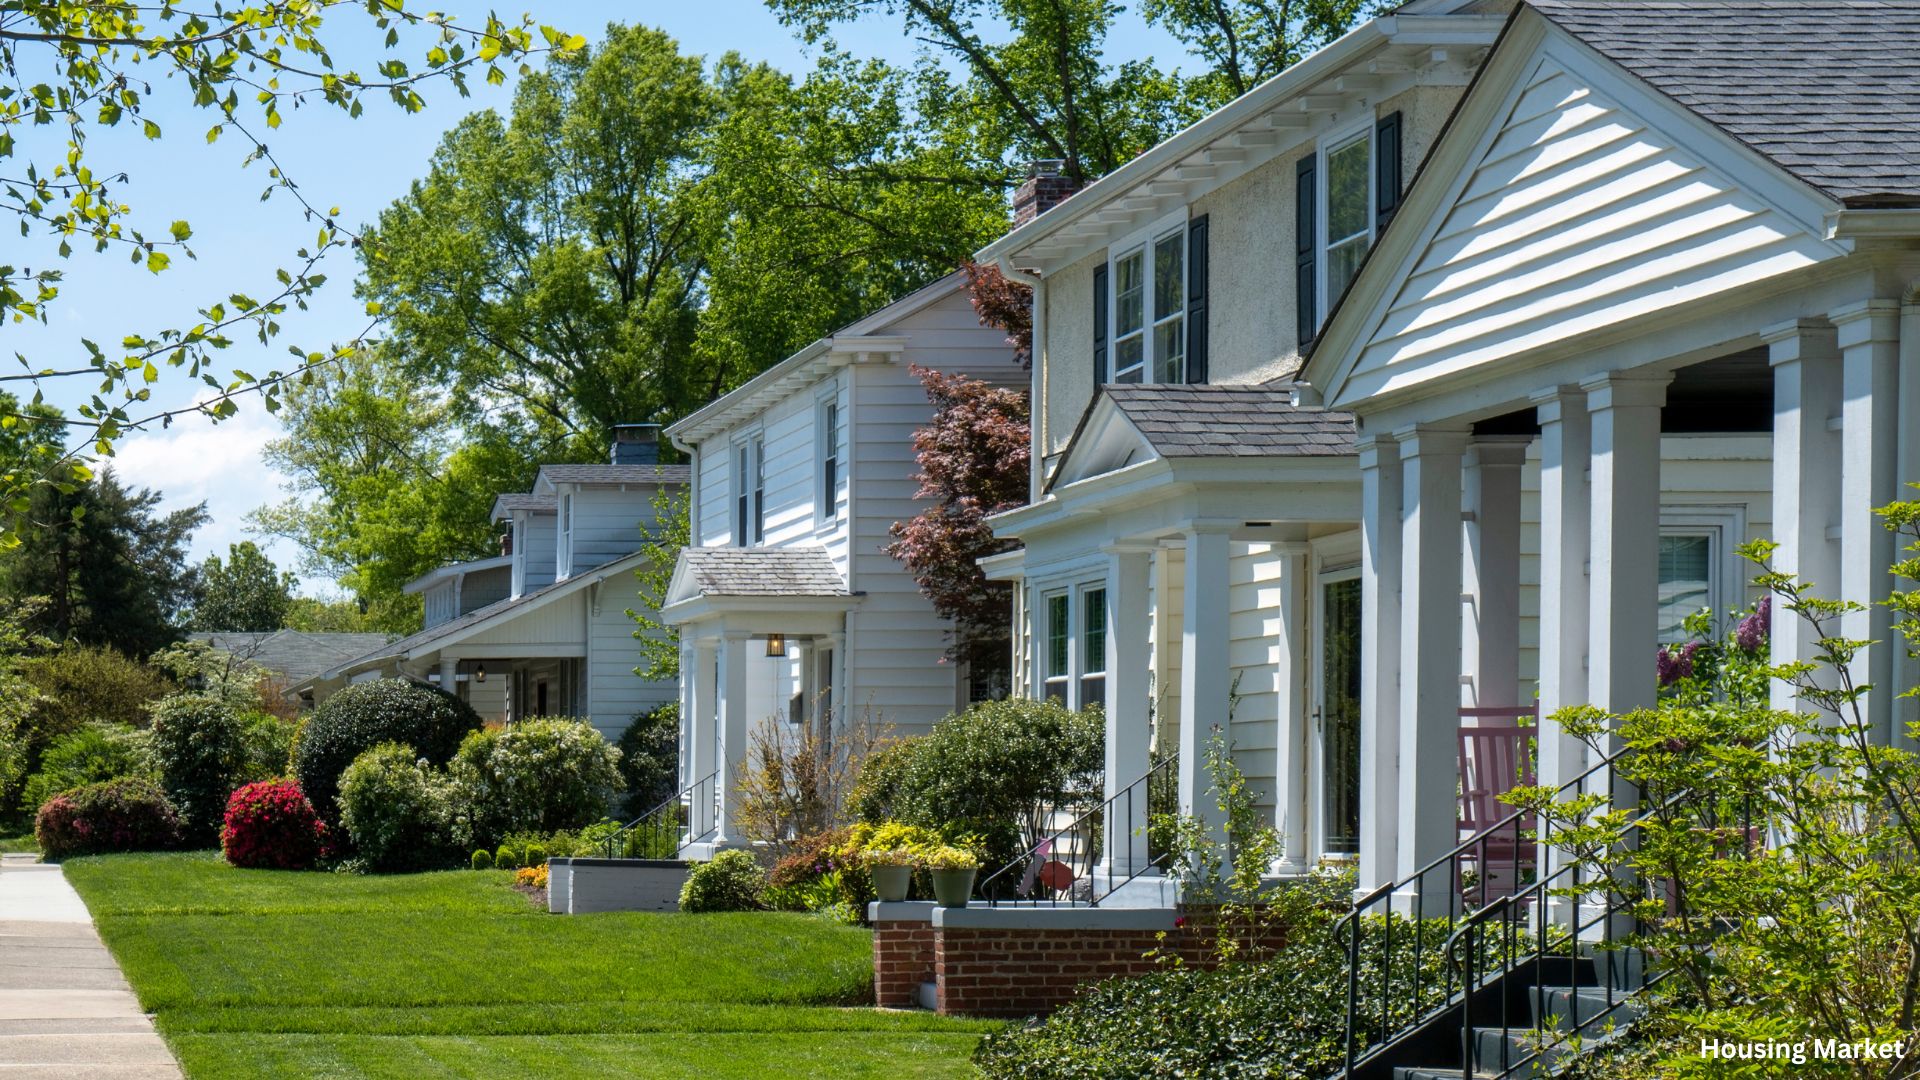
While the spike in average US square foot costs is a national phenomenon, regional variations are significant. Metropolitan areas with high demand and limited housing stock, such as San Francisco, New York City, and Austin, have seen some of the most substantial increases. In contrast, more rural areas or regions with greater housing availability have experienced more moderate price hikes.
Impact on Homebuyers and Sellers
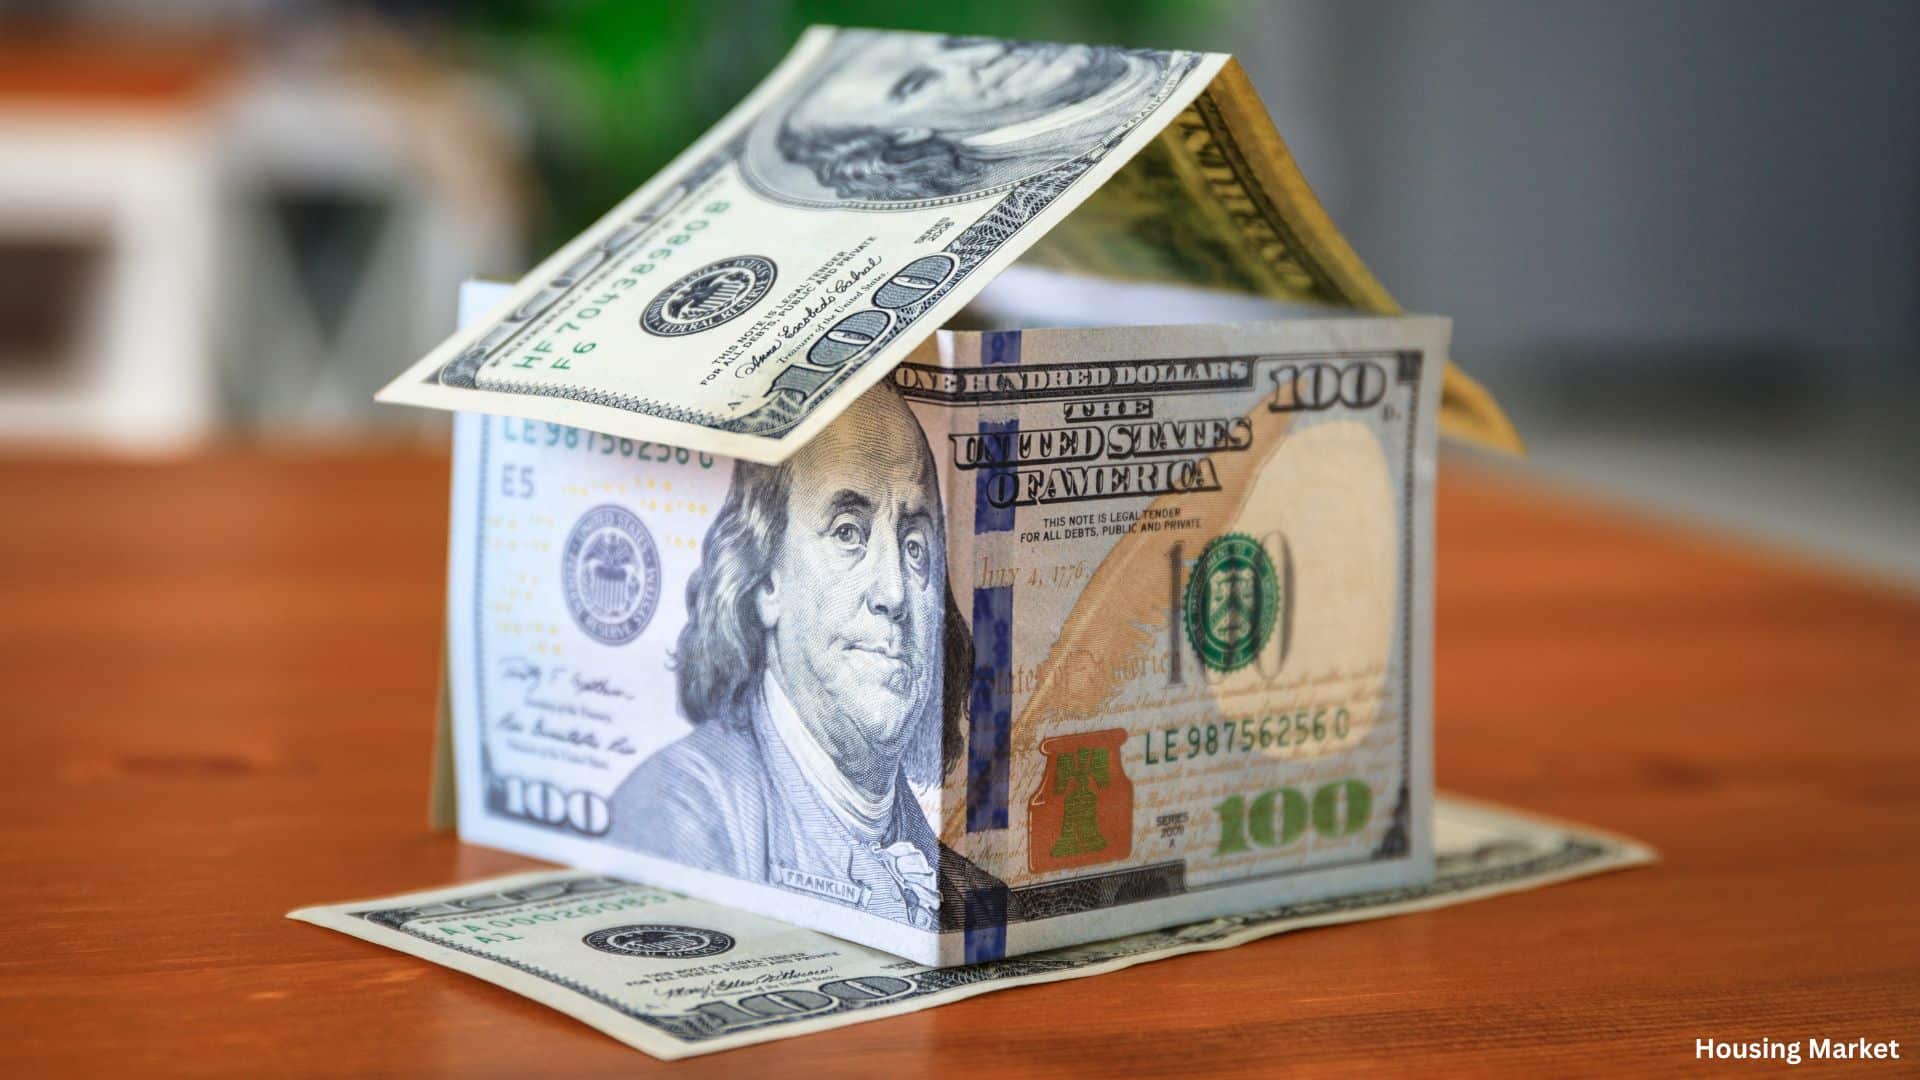
The surge in square foot costs has profound implications for both homebuyers and sellers. For buyers, the increased prices mean higher monthly mortgage payments and a more challenging affordability landscape. Many first-time buyers are finding it difficult to enter the market, leading to a greater reliance on rental properties.

Sellers, on the other hand, benefit from the increased home values. However, those looking to sell and buy a new home face the challenge of higher costs in their subsequent purchases, potentially offsetting the gains from their sales.
Future Outlook
Looking ahead, the future of the US housing market and square foot costs remains uncertain. While some experts predict a stabilization as the market corrects itself, others anticipate continued growth, albeit at a slower pace. Key factors to watch include interest rate changes, economic conditions, and housing policy developments.
The spike in average US square foot costs since 2019 highlights the dynamic and often unpredictable nature of the real estate market. As buyers and sellers navigate these changes, understanding the underlying factors and regional differences will be crucial in making informed decisions.
Related posts:
 Tenant-Based Rental Subsidies: A $7.9M Initiative in Montgomery County, Dayton
 Mortgage Rate Surge: Navigating the April 2024 Increase
 New Home Sales in March 2024 Increase
 KBIS 2024’s DesignBites 10 Kitchen and Bath Innovators
 Kentucky Rental Investment: $223 Million Boost for Housing in Four Counties

